-
Notifications
You must be signed in to change notification settings - Fork 4k
[Edit] Matplotlib - Python: PyPlot #6872
New issue
Have a question about this project? Sign up for a free GitHub account to open an issue and contact its maintainers and the community.
By clicking “Sign up for GitHub”, you agree to our terms of service and privacy statement. We’ll occasionally send you account related emails.
Already on GitHub? Sign in to your account
Merged
Merged
Changes from 10 commits
Commits
Show all changes
13 commits
Select commit
Hold shift + click to select a range
d0dd9bd
[Edit] SQL: DATEDIFF()
mamtawardhani 9f5c19b
Update datediff.md
mamtawardhani c32e9f3
Merge branch 'Codecademy:main' into main
mamtawardhani 4170ba2
Merge branch 'Codecademy:main' into main
mamtawardhani 527fdb6
[Edit] Matplotlib - Python: PyPlot
mamtawardhani 9731d5e
Add files via upload
mamtawardhani bc2bcdb
Update content/matplotlib/concepts/pyplot/pyplot.md
avdhoottt 4b17962
Update content/matplotlib/concepts/pyplot/pyplot.md
avdhoottt 5d82012
Update content/matplotlib/concepts/pyplot/pyplot.md
avdhoottt 4ca6194
Update content/matplotlib/concepts/pyplot/pyplot.md
avdhoottt 372756e
Update content/matplotlib/concepts/pyplot/pyplot.md
avdhoottt d93bf59
Update content/matplotlib/concepts/pyplot/pyplot.md
avdhoottt a3f29fe
Merge branch 'main' into pyplot
avdhoottt File filter
Filter by extension
Conversations
Failed to load comments.
Loading
Jump to
Jump to file
Failed to load files.
Loading
Diff view
Diff view
There are no files selected for viewing
This file contains hidden or bidirectional Unicode text that may be interpreted or compiled differently than what appears below. To review, open the file in an editor that reveals hidden Unicode characters.
Learn more about bidirectional Unicode characters
| Original file line number | Diff line number | Diff line change |
|---|---|---|
| @@ -1,24 +1,138 @@ | ||
| --- | ||
| Title: 'pyplot' | ||
| Description: 'The pyplot module provides the interface for creating figures and plotting data points in Matplotlib.' | ||
| Description: 'Provides a MATLAB-like interface for creating plots and visualizations in Python using matplotlib.' | ||
| Subjects: | ||
| - 'Computer Science' | ||
| - 'Data Science' | ||
| - 'Data Visualization' | ||
| Tags: | ||
| - 'Graphs' | ||
| - 'Libraries' | ||
| - 'Matplotlib' | ||
| - 'Python' | ||
| CatalogContent: | ||
| - 'learn-python-3' | ||
| - 'paths/computer-science' | ||
| - 'paths/data-science' | ||
| --- | ||
|
|
||
| In Matplotlib, the **`pyplot`** module provides the interface for creating figures for plotting data points on the screen. | ||
| **`pyplot`** is a state-based interface module in the matplotlib library that provides a MATLAB-like way of plotting in Python. It serves as the primary entry point for creating plots and visualizations by offering a collection of functions that make changes to a figure, such as creating a figure, creating a plotting area in a figure, plotting lines, decorating the plot with labels, and more. The module maintains an internal state that tracks the current figure and axes, allowing users to build plots incrementally without explicitly managing figure objects. | ||
|
|
||
| `pyplot` is widely used in data science, scientific computing, academic research, and business analytics for creating static, animated, and interactive visualizations. It's particularly popular for exploratory data analysis, creating publication-quality plots, generating reports with embedded charts, and building dashboards. The module's simple syntax makes it ideal for quick plotting tasks, prototyping visualizations, and educational purposes where users need to create plots with minimal code. | ||
|
|
||
| ## Syntax | ||
|
|
||
| ```pseudo | ||
| `pyplot` does not have a single syntax since it's a collection of plotting functions. Instead, here are the essential steps to create plots using pyplot: | ||
|
|
||
| 1. **Import the module**: `import matplotlib.pyplot as plt` | ||
| 2. **Prepare data**: Create or load the data to be plotted | ||
| 3. **Create plot**: Use plotting functions like `plt.plot()`, [`plt.scatter()`](https://www.codecademy.com/resources/docs/matplotlib/pyplot/scatter), [`plt.bar()`](https://www.w3schools.com/python/matplotlib_pyplot.asp), etc. | ||
avdhoottt marked this conversation as resolved.
Show resolved
Hide resolved
|
||
| 4. **Customize plot**: Add labels, titles, legends using functions like `plt.xlabel()`, `plt.title()`, `plt.legend()` | ||
| 5. **Display plot**: Use `plt.show()` to display the plot or `plt.savefig()` to save it | ||
|
|
||
| Common pyplot functions include: | ||
|
|
||
| - `plt.plot()`: Creates line plots and scatter plots | ||
| - [`plt.bar()`](https://www.codecademy.com/resources/docs/matplotlib/pyplot/bar): Creates bar charts | ||
| - [`plt.hist()`](https://www.codecademy.com/resources/docs/matplotlib/pyplot/hist): Creates histograms | ||
| - [`plt.scatter()`](https://www.codecademy.com/resources/docs/matplotlib/pyplot/scatter): Creates scatter plots | ||
| - `plt.xlabel()`: Sets x-axis label | ||
| - `plt.ylabel()`: Sets y-axis label | ||
| - `plt.title()`: Sets plot title | ||
| - [`plt.legend()`](https://www.codecademy.com/resources/docs/matplotlib/pyplot/legend): Adds legend to the plot | ||
| - `plt.show()`: Displays the plot | ||
| - `plt.savefig()`: Saves the plot to a file | ||
|
|
||
| `pyplot` functions typically modify the current figure and axes, and most functions return the created objects for further customization. | ||
|
|
||
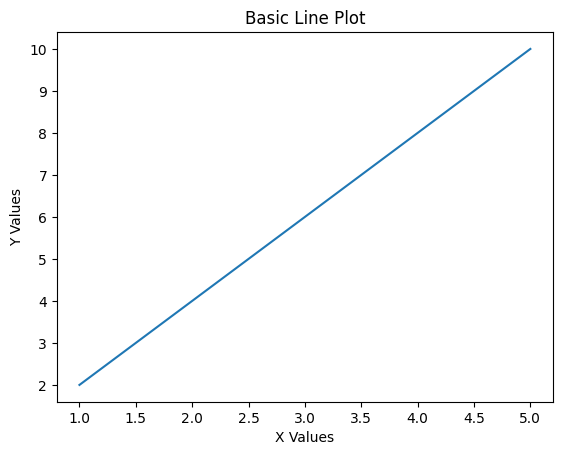
| ## Example 1: Basic Line Plot using `pyplot` | ||
|
|
||
| This example demonstrates the fundamental usage of `pyplot` to create a simple line plot, which is the most common starting point for data visualization: | ||
|
|
||
| ```py | ||
| import matplotlib.pyplot as plt | ||
| import numpy as np | ||
|
|
||
| # Create sample data | ||
| x = np.array([1, 2, 3, 4, 5]) # X-axis values | ||
| y = np.array([2, 4, 6, 8, 10]) # Y-axis values | ||
|
|
||
| # Create a line plot | ||
| plt.plot(x, y) | ||
|
|
||
| # Add labels and title | ||
| plt.xlabel('X Values') | ||
| plt.ylabel('Y Values') | ||
| plt.title('Basic Line Plot') | ||
|
|
||
| # Display the plot | ||
| plt.show() | ||
| ``` | ||
|
|
||
| The `pyplot` module is made available in an `import` statement and usually under an alias like `plt`. | ||
| The output of this code will be: | ||
|
|
||
|  | ||
|
|
||
| This example creates a simple line plot connecting five points. The `plt.plot()` function takes the x and y coordinates and draws a line connecting them. The `plt.xlabel()`, `plt.ylabel()`, and `plt.title()` functions add descriptive labels to make the plot more informative and professional-looking. | ||
|
|
||
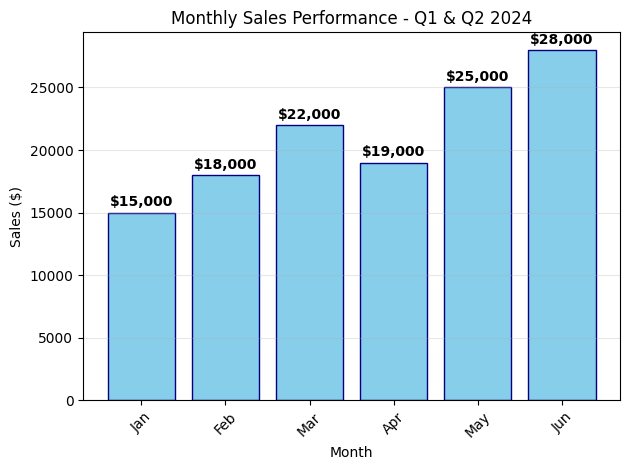
| ## Example 2: Sales Data Visualization | ||
|
|
||
| This example shows how pyplot can be used to visualize real-world business data, specifically monthly sales figures for analysis and reporting. | ||
|
|
||
| ```py | ||
| import matplotlib.pyplot as plt | ||
| import numpy as np | ||
|
|
||
| # Monthly sales data for a retail store | ||
| months = ['Jan', 'Feb', 'Mar', 'Apr', 'May', 'Jun'] | ||
| sales = [15000, 18000, 22000, 19000, 25000, 28000] # Sales in dollars | ||
|
|
||
| # Create a bar chart for better categorical data representation | ||
| plt.bar(months, sales, color='skyblue', edgecolor='navy') | ||
|
|
||
| # Customize the plot for professional presentation | ||
| plt.xlabel('Month') | ||
| plt.ylabel('Sales ($)') | ||
| plt.title('Monthly Sales Performance - Q1 & Q2 2024') | ||
|
|
||
| # Add value labels on top of each bar | ||
| for i, v in enumerate(sales): | ||
| plt.text(i, v + 500, f'${v:,}', ha='center', fontweight='bold') | ||
|
|
||
| # Rotate x-axis labels for better readability | ||
| plt.xticks(rotation=45) | ||
|
|
||
| # Add grid for easier value reading | ||
| plt.grid(axis='y', alpha=0.3) | ||
|
|
||
| # Adjust layout to prevent label cutoff | ||
| plt.tight_layout() | ||
|
|
||
| # Display the plot | ||
| plt.show() | ||
| ``` | ||
|
|
||
| The output of this code will be: | ||
|
|
||
|  | ||
|
|
||
| This example demonstrates the practical business use of pyplot for sales analysis. It creates a professional-looking bar chart with customized colors, value labels, grid lines, and proper formatting. The `plt.tight_layout()` function ensures all elements fit properly within the figure boundaries. | ||
|
|
||
| ## Frequently Asked Questions | ||
|
|
||
| ### 1. What is the difference between `pyplot` and `matplotlib`? | ||
|
|
||
| The `matplotlib` is the entire plotting library, while `pyplot` is a specific module within matplotlib that provides a MATLAB-like interface. `pyplot` is the most commonly used part of `matplotlib` for creating quick plots and interactive visualizations. | ||
|
|
||
| ### 2. Do I need to call `plt.show()` every time? | ||
|
|
||
| Yes, `plt.show()` is required to display plots in most environments. However, in Jupyter notebooks, plots may display automatically, and when saving plots with `plt.savefig()`, you don't need `plt.show()` unless you also want to display the plot. | ||
|
|
||
| ### 3. Can I create multiple plots in one script? | ||
|
|
||
| Yes, you can create multiple separate plots by calling `plt.figure()` before each new plot, or create subplots within a single figure using `plt.subplot()` or `plt.subplots()`. | ||
|
|
||
| ### 4. How do I save plots instead of displaying them? | ||
|
|
||
| Use `plt.savefig('filename.png')` before `plt.show()`. You can save in various formats, including PNG, PDF, SVG, and JPEG, by changing the file extension. | ||
|
|
||
| ### 5. Is pyplot suitable for complex, multi-panel figures? | ||
|
|
||
| While pyplot can handle complex figures, the object-oriented matplotlib API is recommended for complex, multi-panel figures as it provides more control and is easier to manage programmatically. | ||
Loading
Sorry, something went wrong. Reload?
Sorry, we cannot display this file.
Sorry, this file is invalid so it cannot be displayed.
Loading
Sorry, something went wrong. Reload?
Sorry, we cannot display this file.
Sorry, this file is invalid so it cannot be displayed.
Add this suggestion to a batch that can be applied as a single commit.
This suggestion is invalid because no changes were made to the code.
Suggestions cannot be applied while the pull request is closed.
Suggestions cannot be applied while viewing a subset of changes.
Only one suggestion per line can be applied in a batch.
Add this suggestion to a batch that can be applied as a single commit.
Applying suggestions on deleted lines is not supported.
You must change the existing code in this line in order to create a valid suggestion.
Outdated suggestions cannot be applied.
This suggestion has been applied or marked resolved.
Suggestions cannot be applied from pending reviews.
Suggestions cannot be applied on multi-line comments.
Suggestions cannot be applied while the pull request is queued to merge.
Suggestion cannot be applied right now. Please check back later.
Uh oh!
There was an error while loading. Please reload this page.