Skip to content

gatekeeper-controller-manager is leaking memory #2654

New issue

Have a question about this project? Sign up for a free GitHub account to open an issue and contact its maintainers and the community.

By clicking “Sign up for GitHub”, you agree to our terms of service and privacy statement. We’ll occasionally send you account related emails.

Already on GitHub? Sign in to your account

Closed
dethi opened this issue Mar 29, 2023 · 33 comments · Fixed by #2690
Closed

gatekeeper-controller-manager is leaking memory #2654

dethi opened this issue Mar 29, 2023 · 33 comments · Fixed by #2690
Labels
bug Something isn't working

Comments

@dethi
Copy link
Contributor

dethi commented Mar 29, 2023

What steps did you take and what happened:

On all our GKE clusters, gatekeeper-controller-manager get OOM Killed once every ~24-30h. You can see on the screenshot below that the memory keep increasing over time, which indicate to me that there is a memory leak somewhere.

gatekeeper-controller-manager memory increase

I just enabled pprof, I will add heap profile as soon as I have them

What did you expect to happen:
Memory usage to be stable over time.

Anything else you would like to add:
This was already happening on the previous version we were running, openpolicyagent/gatekeeper:v3.10.0-beta.0

Environment:

  • Gatekeeper version: openpolicyagent/gatekeeper:v3.11.0
  • Kubernetes version: (use kubectl version): v1.23.14-gke.1800
  • 3 replicas of gatekeeper-controller-manager:
      --port=8443
      --health-addr=:9090
      --prometheus-port=8888
      --logtostderr
      --log-denies=true
      --emit-admission-events=true
      --log-level=DEBUG
      --exempt-namespace=gatekeeper-system
      --operation=webhook
      --enable-external-data=true
      --enable-generator-resource-expansion=false
      --log-mutations=true
      --mutation-annotations=false
      --disable-cert-rotation=false
      --max-serving-threads=-1
      --tls-min-version=1.3
      --metrics-backend=prometheus
      --enable-tls-healthcheck
      --operation=mutation-webhook
      --disable-opa-builtin={http.send}
      --exempt-namespace-prefix=kube
      --enable-pprof
      --pprof-port=6060
@dethi dethi added the bug Something isn't working label Mar 29, 2023
@dethi
Copy link
Contributor Author

dethi commented Mar 29, 2023

Heap Dump: one taken a few minutes after the start and one taken 3h later
gatekeeper-controller-manager-7f58485448-d8rsl--heap.zip

Goroutines stacktrace:
gatekeeper-controller-manager-7f58485448-d8rsl--goroutine.txt

@dethi
Copy link
Contributor Author

dethi commented Mar 29, 2023

Looking at the stacktrace, I think it's leaking connections (considering the growing number of readLoop/writeLoop goroutines)

@davis-haba
Copy link
Contributor

Thank you for the detailed write up!

How are you analyzing the heap dump? We tried opening it with

go tool pprof -http=:8082 gatekeeper-controller-manager-7f58485448-d8rsl--3h-later-heap

but this yields an error: gatekeeper-controller-manager-7f58485448-d8rsl--3h-later-heap: parsing profile: unrecognized profile format

@dethi
Copy link
Contributor Author

dethi commented Mar 30, 2023

🤔 I just did that and it opened for me

go tool pprof -http :8080 gatekeeper-controller-manager-7f58485448-d8rsl--3h-later-heap

(I'm using go version go1.20.1 darwin/amd64)

@maxsmythe
Copy link
Contributor

Stack trace working for me. It definitely seems like there is a lot of space being used by http read/write buffers.

Does the memory use increasing over time happen to the audit pod and the webhook pods, or just the webhook pods?

@maxsmythe
Copy link
Contributor

@ritazh @sozercan

I wonder if this is from external data creating multiple clients?

From the golang docs:

The Client's Transport typically has internal state (cached TCP connections), so Clients should be reused instead of created as needed. Clients are safe for concurrent use by multiple goroutines.

Our code appears to create a new client for every request:

https://github.com/open-policy-agent/frameworks/blob/745f2b50cfcb746bb30997d65e851d1b6ee0b9e9/constraint/pkg/externaldata/request.go#L62-L145

@dethi does disabling calls to external data remove the leak?

@maxsmythe
Copy link
Contributor

Interesting, maybe-on-topic finds.

golang/go#43966

https://coder.com/blog/go-leak-mysteries

Note that it does look like we're closing the response body.

@dethi
Copy link
Contributor Author

dethi commented Apr 1, 2023

Does the memory use increasing over time happen to the audit pod and the webhook pods, or just the webhook pods?

Only the webhook pods. The audit pod has stable memory usage.

@dethi does disabling calls to external data remove the leak?

We don't have any external configured and don't use external data at the moment, but I can try to disable it.

@dethi
Copy link
Contributor Author

dethi commented Apr 1, 2023

Still leaking with external-data disabled.

@ritazh
Copy link
Member

ritazh commented Apr 3, 2023

This was already happening on the previous version we were running, openpolicyagent/gatekeeper:v3.10.0-beta.0

Can you please confirm the same feature flags used with older versions of Gatekeeper did not have this issue?

@dethi
Copy link
Contributor Author

dethi commented Apr 3, 2023

openpolicyagent/gatekeeper:v3.10.0-beta.0 was the first version that we deployed.

@davis-haba
Copy link
Contributor

davis-haba commented Apr 3, 2023

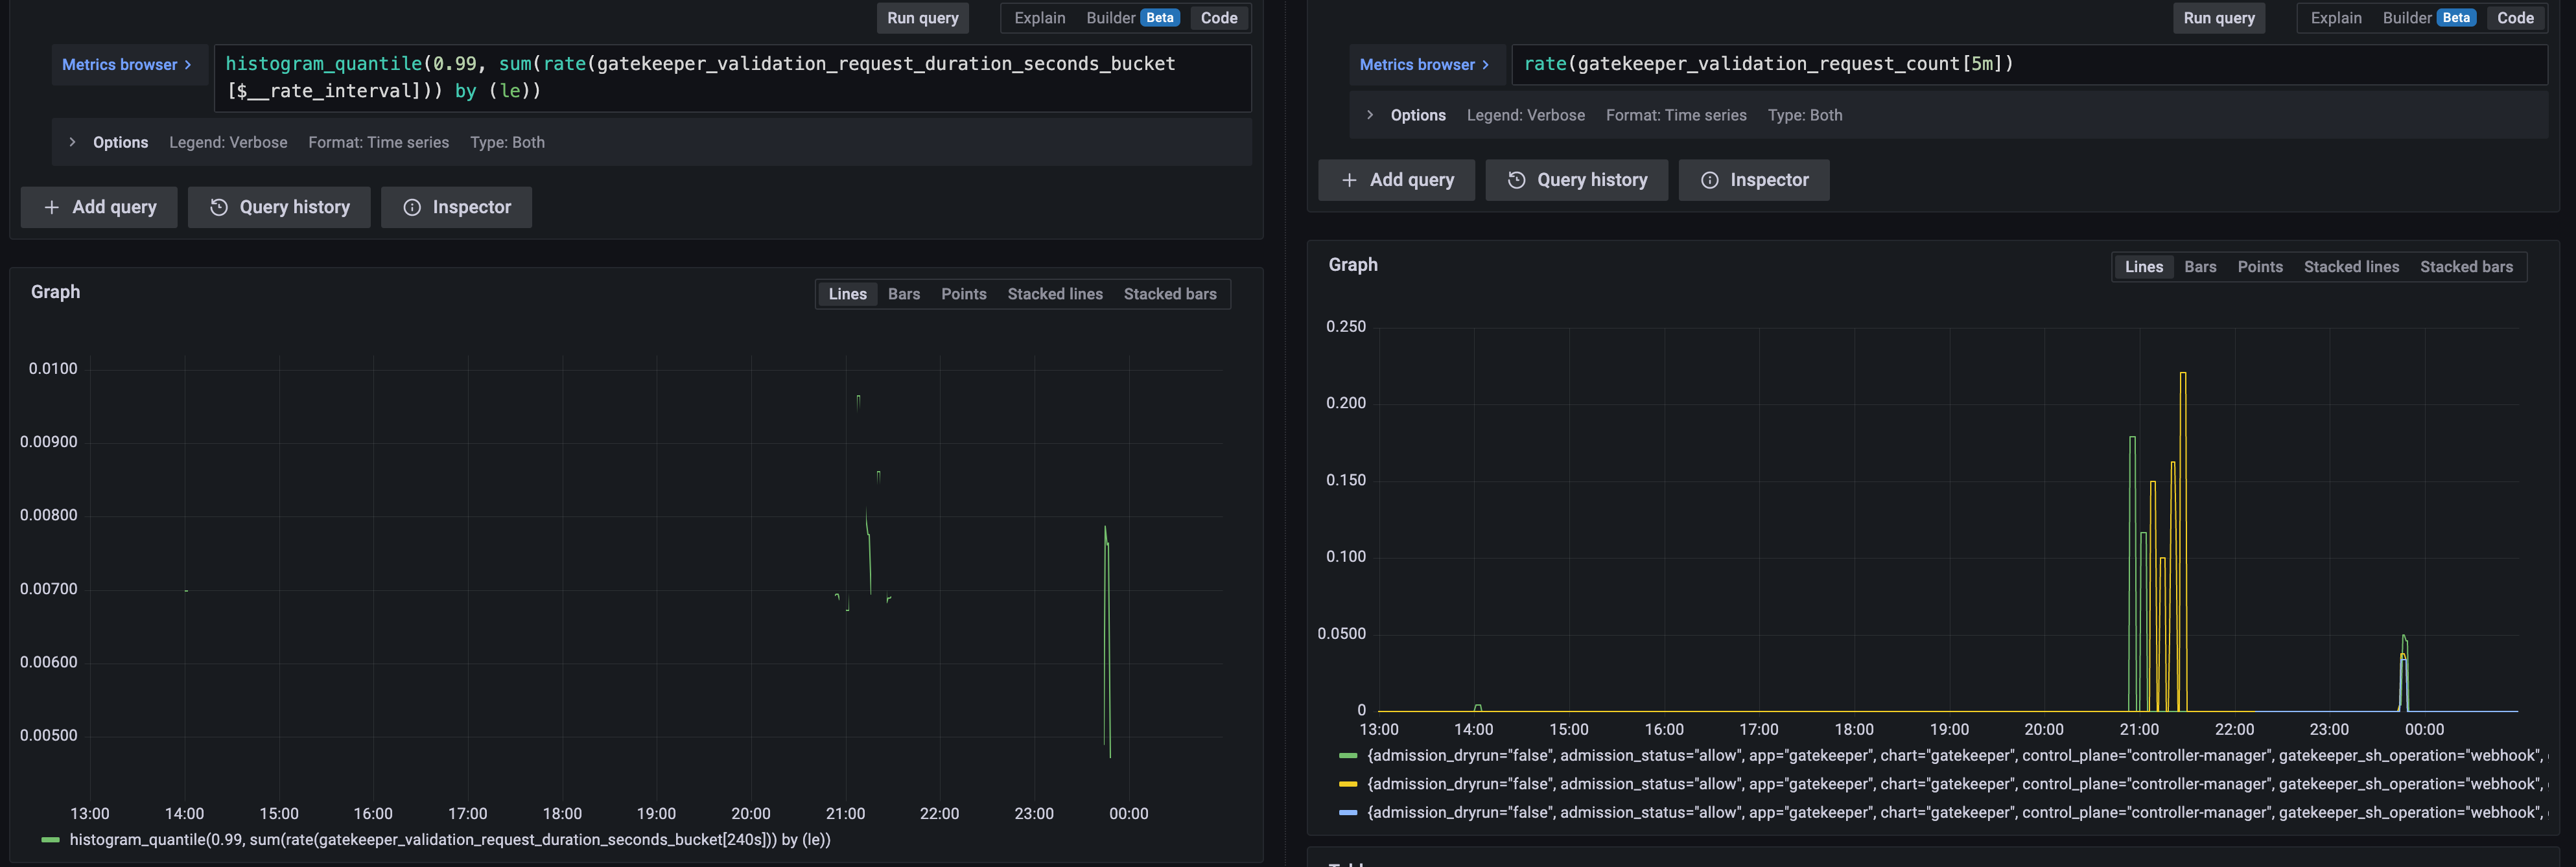
Hey @dethi,

We're still trying to chase down this leak, but could use a little more to go off.

We noticed a lot of http calls in the heap dump. One theory is that event emitter could be leaking connections. To this end, could you try disabling admission events (set the flag --emit-admission-events=false) and see if it still leaks?

We're also curious about the admission webhook's usage. Is this a relatively static cluster, where resource are not changed very frequently? Or is it more like a test cluster where resources are getting created and destroyed frequently (particularly namespaces)? If you have metrics set up, it would be helpful if could share the values/graphs for gatekeeper_validation_request_count, and also gatekeeper_validation_request_duration_seconds (the cumulative distribution).

A couple other quick questions:

  • Are you using mutations? If not, try disabling the mutation operation please (remove flag: --operation=mutation-webhook)
  • Are you using replicated data, i.e. setting sync values on the Config resource? If so, which GVKs are you syncing?

Thanks :)

@dethi
Copy link
Contributor Author

dethi commented Apr 4, 2023

To this end, could you try disabling admission events (set the flag --emit-admission-events=false) and see if it still leaks?

I will change that now and reports the result tomorrow!

Is this a relatively static cluster, where resource are not changed very frequently?

Both. We see this same leak happening on all our clusters, dev and prod. dev clusters have a lot of churn (new namespace/deployment created at least every 10-15min). Prod cluster have relatively low churn (outside of a daily deploy and a cronjob that run every 5min).

Are you using mutations? If not, try disabling the mutation operation please (remove flag: --operation=mutation-webhook)

Not using any mutation at the moment. I will disable it after the --emit-admission-events=false test, depending on the result.

Are you using replicated data, i.e. setting sync values on the Config resource? If so, which GVKs are you syncing?

No, we aren't using replicated data.

If you have metrics set up, it would be helpful if could share the values/graphs

Yes we do :). Here is an example of what the metrics looks like on a prod cluster. Looking at the last 12h, pretty quiet. Happy to share more if you think it shows something interesting.

Screenshot 2023-04-04 at 00 59 55

@dethi
Copy link
Contributor Author

dethi commented Apr 4, 2023

Tried both --emit-admission-events=false and --operation=mutation-webhook separately, and the process is still leaking memory at the same rate. I'm trying both at the same time now.

EDIT: both at the same time has the same effect: still leaking.

@dethi
Copy link
Contributor Author

dethi commented Apr 4, 2023

One thing that I noticed in the logs, not sure if it's normal or not, but the controller seems to reconcile the constraint every ~10mins, even when there was no change to the constraint or constraint template.

Screenshot 2023-04-04 at 10 28 15

@maxsmythe
Copy link
Contributor

maxsmythe commented Apr 5, 2023

Thank you for helping us gather data!

One thing that I noticed in the logs, not sure if it's normal or not, but the controller seems to reconcile the constraint every ~10mins, even when there was no change to the constraint or constraint template.

This could be due to a watch getting interrupted, though periodic re-reconciliation is expected in how controller-runtime works (I forget the default frequency).

You mentioned the audit pod does not have this memory leak behavior. Is that still true? Does it also have these log messages?

How many total constraints do you have on your cluster?

Another explanation could be due to changes to ConstraintPodStatus resources:

err = c.Watch(
&source.Kind{Type: &constraintstatusv1beta1.ConstraintPodStatus{}},
handler.EnqueueRequestsFromMapFunc(constraintstatus.PodStatusToConstraintMapper(true, util.EventPackerMapFunc())),
)

Or reconciling changes to the status field of the constraint due to audit updating the violating resources on the constraint (this would not increment metadata.generation).

The weird thing is that if audit is unaffected, it should be something specific to the webhook process and not controllers, since the audit/status pods share the same controllers and watch the same resources.

Double weird is that the webhook has fairly low activity, which would point against it being due to the webhook serving requests, which would point to controllers.

If audit is still symptom-free, what flags does the audit pod have?

If the audit pod has a --disable-cert-rotation flag, what happens if you add that flag to the webhook pods? The webhook pods should still work as long as you don't touch any secrets in gatekeeper-system and don't modify Gatekeeper's ValidatingWebhookConfiguration (though I'd definitely avoid doing this in prod to be safe). The flag should be re-enabled before the self-signed cert expires (IIRC default is a decade).

@dethi
Copy link
Contributor Author

dethi commented Apr 5, 2023

You mentioned the audit pod does not have this memory leak behavior. Is that still true? Does it also have these log messages?

Yes, audit pod doesn't have this memory leak. And yes, it is also logging handling constraint update at the same interval.

How many total constraints do you have on your cluster?

At the moment, only 3.

If audit is still symptom-free, what flags does the audit pod have?

    Args:
      --audit-interval=60
      --log-level=DEBUG
      --constraint-violations-limit=20
      --audit-from-cache=false
      --audit-chunk-size=500
      --audit-match-kind-only=false
      --emit-audit-events=true
      --operation=audit
      --operation=status
      --operation=mutation-status
      --logtostderr
      --health-addr=:9090
      --prometheus-port=8888
      --enable-external-data=true
      --enable-generator-resource-expansion=true
      --metrics-backend=prometheus
      --disable-cert-rotation=true

what happens if you add that flag to the webhook pods?

I will try that and come back to you!

@dethi
Copy link
Contributor Author

dethi commented Apr 5, 2023

Still leaking memory with --disable-cert-rotation 🙁

@ritazh
Copy link
Member

ritazh commented Apr 5, 2023

Can you share your rego? is the same rego/constraint template being used for both webhook and audit?

@dethi
Copy link
Contributor Author

dethi commented Apr 5, 2023

Yes, both audit and the controller are using the exact same constraint and ConstraintTemplate.

The 3 constraints use:

apiVersion: templates.gatekeeper.sh/v1
kind: ConstraintTemplate
metadata:
  name: k8sblockloadbalancer
  annotations:
    metadata.gatekeeper.sh/title: "Block Services with type LoadBalancer"
    description: >-
      Block Services with type LoadBalancer, except if it's in the allowed list.
spec:
  crd:
    spec:
      names:
        kind: K8sBlockLoadBalancer
      validation:
        openAPIV3Schema:
          type: object
          properties:
            allowed:
              description: "List of allowed Loadbalancer"
              type: array
              items:
                type: object
                properties:
                  namespace:
                    type: string
                  name:
                    type: string
                  allow_external:
                    type: boolean
  targets:
    - target: admission.k8s.gatekeeper.sh
      rego: |
        package k8sblockloadbalancer

        import future.keywords.in

        violation[{"msg": msg}] {
          input.review.kind.kind == "Service"
          input.review.object.spec.type == "LoadBalancer"
          not allowed
          msg := "Service of type LoadBalancer is not allowed."
        }

        allowed {
          some item in input.parameters.allowed

          item.namespace == input.review.object.metadata.namespace
          item.name == input.review.object.metadata.name

          allowed_lb_type(item)
        }

        allowed_lb_type(item) {
          item.allow_external
        }

        allowed_lb_type(item) {
          not item.allow_external
          object.get(input.review.object.metadata.annotations, "cloud.google.com/load-balancer-type", "") == "Internal"
        }

@maxsmythe
Copy link
Contributor

If you take a webhook pod and run another copy under a different name and with different labels (this ensures there will be zero webhook traffic since it's not part of the webhook service), does the memory leak still occur?

@maxsmythe
Copy link
Contributor

Also curious how much memory the audit pod uses?

@maxsmythe
Copy link
Contributor

The heap dump seems to show most memory usage associated with processing the webhook, which seems to jive with the theory that it's serving requests that's causing memory consumption. The zero-traffic test should confirm that's the right area of investigation.

Assuming it is, the next step is why/how? Especially if the cluster is low-traffic. Do low traffic clusters leak at the same rate as clusters with higher Gatekeeper QPS?

Does setting --max-serving-threads=1 affect the memory profile (note this might leave Gatekeeper under-resourced to handle inbound QPS.

How much CPU does the webhook pod have? If <1, does increasing it to somewhere between 1-2 fix the issue?

@dethi
Copy link
Contributor Author

dethi commented Apr 6, 2023

I have taken a new heap dump, when the memory was much higher (180MB), to show more clearly where the leak is coming from (inuse_space):

Screenshot 2023-04-06 at 12 08 37

gatekeeper-controller-manager-754cbf66bd-r88tt--heap.zip

@dethi
Copy link
Contributor Author

dethi commented Apr 6, 2023

How much CPU does the webhook pod have?

CPU req 100m, limit 1. They barely use anything at all.

Screenshot 2023-04-05 at 20 31 18

Do low traffic clusters leak at the same rate as clusters with higher Gatekeeper QPS?

Yes, they all leak at the same rate.

Also curious how much memory the audit pod uses?

image

@maxsmythe
Copy link
Contributor

Thanks for the extra data! I'll take a look at the dump. Since there are a lot of potential places where HTTP connections can be initiated, I'm trying to narrow down what areas of code are the most likely candidates.

Did you get a chance to run this test?

If you take a webhook pod and run another copy under a different name and with different labels (this ensures there will be zero webhook traffic since it's not part of the webhook service), does the memory leak still occur?

@dethi
Copy link
Contributor Author

dethi commented Apr 6, 2023

I missed that part. Trying it now, will report the result tomorrow!

@dethi
Copy link
Contributor Author

dethi commented Apr 7, 2023

Here is the result of the webhook pods: still leaking even with no webhook being served.

Screenshot 2023-04-07 at 11 00 00

Here is the new deployment I deployed:

Name:                   gatekeeper-controller-manager-test
Namespace:              gatekeeper-system
CreationTimestamp:      Thu, 06 Apr 2023 23:32:09 +0100
Labels:                 app=gatekeeper-test
Annotations:            deployment.kubernetes.io/revision: 1
Selector:               app=gatekeeper-test
Replicas:               3 desired | 3 updated | 3 total | 3 available | 0 unavailable
StrategyType:           RollingUpdate
MinReadySeconds:        0
RollingUpdateStrategy:  25% max unavailable, 25% max surge
Pod Template:
  Labels:           app=gatekeeper-test
  Annotations:      prometheus.io/port: 8888
                    prometheus.io/scrape: true
  Service Account:  gatekeeper-admin
  Containers:
   manager:
    Image:       openpolicyagent/gatekeeper:v3.11.0
    Ports:       8443/TCP, 8888/TCP, 9090/TCP
    Host Ports:  0/TCP, 0/TCP, 0/TCP
    Command:
      /manager
    Args:
      --port=8443
      --health-addr=:9090
      --prometheus-port=8888
      --logtostderr
      --log-denies=true
      --emit-admission-events=true
      --log-level=DEBUG
      --exempt-namespace=gatekeeper-system
      --operation=webhook
      --enable-external-data=true
      --enable-generator-resource-expansion=true
      --log-mutations=true
      --mutation-annotations=false
      --disable-cert-rotation=true
      --max-serving-threads=-1
      --tls-min-version=1.3
      --metrics-backend=prometheus
      --enable-tls-healthcheck
      --operation=mutation-webhook
      --disable-opa-builtin={http.send}
      --exempt-namespace-prefix=kube
      --enable-pprof=true
    Limits:
      cpu:     1
      memory:  512Mi
    Requests:
      cpu:      100m
      memory:   512Mi
    Liveness:   http-get http://:9090/healthz delay=0s timeout=1s period=10s #success=1 #failure=3
    Readiness:  http-get http://:9090/readyz delay=0s timeout=1s period=10s #success=1 #failure=3
    Environment:
      POD_NAMESPACE:    (v1:metadata.namespace)
      POD_NAME:         (v1:metadata.name)
      NAMESPACE:        (v1:metadata.namespace)
      CONTAINER_NAME:  manager
    Mounts:
      /certs from cert (ro)
  Volumes:
   cert:
    Type:               Secret (a volume populated by a Secret)
    SecretName:         gatekeeper-webhook-server-cert
    Optional:           false
  Priority Class Name:  system-cluster-critical

And confirmation that it wasn't targeted by the webhook:

Name:              gatekeeper-webhook-service
Namespace:         gatekeeper-system
Labels:            app=gatekeeper
                   app.kubernetes.io/managed-by=Helm
                   chart=gatekeeper
                   gatekeeper.sh/system=yes
                   heritage=Helm
                   release=gatekeeper
Annotations:       meta.helm.sh/release-name: gatekeeper
                   meta.helm.sh/release-namespace: gatekeeper-system
Selector:          app=gatekeeper,chart=gatekeeper,control-plane=controller-manager,gatekeeper.sh/operation=webhook,gatekeeper.sh/system=yes,heritage=Helm,release=gatekeeper
Type:              ClusterIP
IP Family Policy:  SingleStack
IP Families:       IPv4
IP:                172.29.88.45
IPs:               172.29.88.45
Port:              https-webhook-server  443/TCP
TargetPort:        webhook-server/TCP
Endpoints:         10.128.12.4:8443,10.128.31.47:8443,10.128.33.48:8443
Session Affinity:  None
Events:            <none>

@dethi
Copy link
Contributor Author

dethi commented Apr 8, 2023

I think I found the origin of the leak using kubectl debug and netstat: the webhook TLS healthcheck. Reading the code, it does seems that we don't ever read and close the body.

I'm gonna validate by first disabling it --enable-tls-healthcheck=false, and the submitting a patch.

dethi added a commit to dethi/gatekeeper that referenced this issue Apr 8, 2023
- The resp.Body was never closed, thus causing one connection to be
  leaked for each executions.

- Creating a new transport based on the default transport, to inherit
  some of the default timeouts. Most importantly, this ensure that there
  is a default TLSHandshakeTimeout (10s) and dial timeout (30s).

- Disable http keep alive, to avoid reuse of the same http connection.
  Otherwise, we may fail the healthcheck when the certs is rotated (new
  cert on disk wouldn't match the cert attached to the reused connection
  opened earlier).

Fix open-policy-agent#2654

Signed-off-by: Thibault Deutsch <[email protected]>
@dethi
Copy link
Contributor Author

dethi commented Apr 8, 2023

That was indeed the origin of the leak. Submitted a fix!

@maxsmythe
Copy link
Contributor

Thank you so much! What was the breadcrumb from netstat/kubectl debug that led you to the health check code? Only remaining inbound connection?

@dethi
Copy link
Contributor Author

dethi commented Apr 10, 2023

  • netstat showed a few connections that were still open from localhost to localhost, and some had a non-empty receiving queue. From this I knew it was gatekeeper calling itself.
  • From the heap profile, I knew it was not only a connection that was kept open, but also that the connection was using TLS.
  • I also knew that the number of goroutines was growing at a stable rate, so it was something happening regularly, every few seconds

I quickly glanced at the flags and saw --enable-tls-healthcheck: it matches all the criteria. Moreover, the default helm install has this flag disabled, we enabled it. From there I was already convinced, even before looking at the code.

@maxsmythe
Copy link
Contributor

Nice debugging! Thanks for sharing.

sozercan pushed a commit to sozercan/gatekeeper that referenced this issue Apr 25, 2023
- The resp.Body was never closed, thus causing one connection to be
  leaked for each executions.

- Creating a new transport based on the default transport, to inherit
  some of the default timeouts. Most importantly, this ensure that there
  is a default TLSHandshakeTimeout (10s) and dial timeout (30s).

- Disable http keep alive, to avoid reuse of the same http connection.
  Otherwise, we may fail the healthcheck when the certs is rotated (new
  cert on disk wouldn't match the cert attached to the reused connection
  opened earlier).

Fix open-policy-agent#2654

Signed-off-by: Thibault Deutsch <[email protected]>
Sign up for free to join this conversation on GitHub. Already have an account? Sign in to comment
Labels
bug Something isn't working
Projects
None yet
Development

Successfully merging a pull request may close this issue.

4 participants